ECMWF AIFS Single forecast validation report
This dataset validation report plots a sample of values from the ECMWF AIFS Single forecast dataset over time and across space, comparing where possible to a previously validated reference dataset. It also reports the quantity of unavailable values and their associated timestamps. These analyses are one layer of a multi-layered dataset validation process we perform at dynamical.org and also provide users a preview of the dataset contents.
Report generation start time: 2026-08-19T14:42:08 UTC
Summary
This dataset has been reviewed and is ready for use. Two things are worth knowing before you use it, both described under Review notes: five variables begin partway through the archive, and one forecast is missing four of its lead times.
What looks good
- Geometry and coordinates are correct on every variable. The declared global 0.25° latitude/longitude grid, north at the top, longitudes running −180° to 179.75° with no seam or shift, and coastlines and terrain in the right places.
- Every field is in its stated units with physically plausible values. Temperatures in degrees Celsius, pressures in pascals, geopotential heights in metres nesting correctly (925 hPa below 850 hPa below 500 hPa), winds in metres per second, precipitation in kilograms per square metre per second, radiation in watts per square metre, cloud cover in percent. No missing-data sentinel values and no visible quantization artifacts.
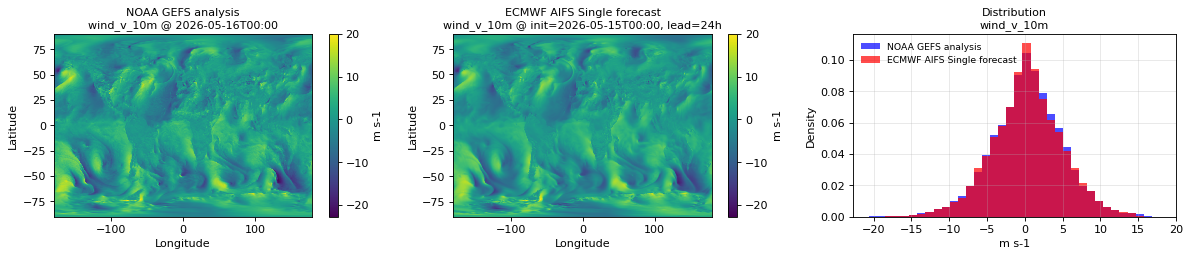
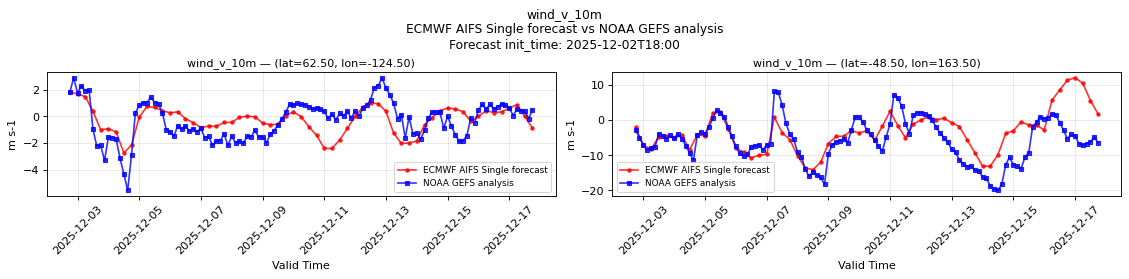
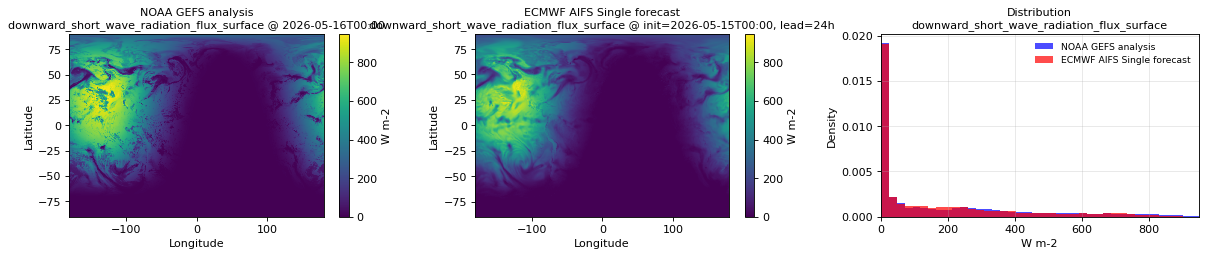
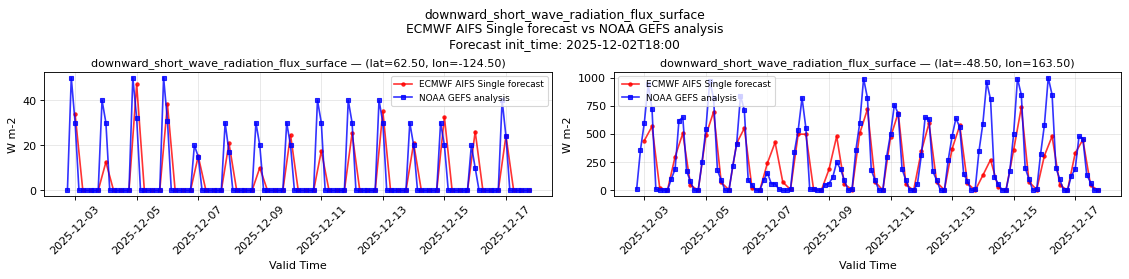
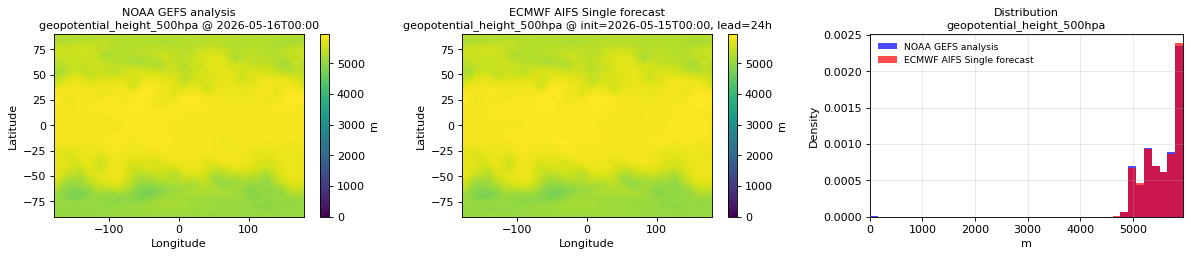
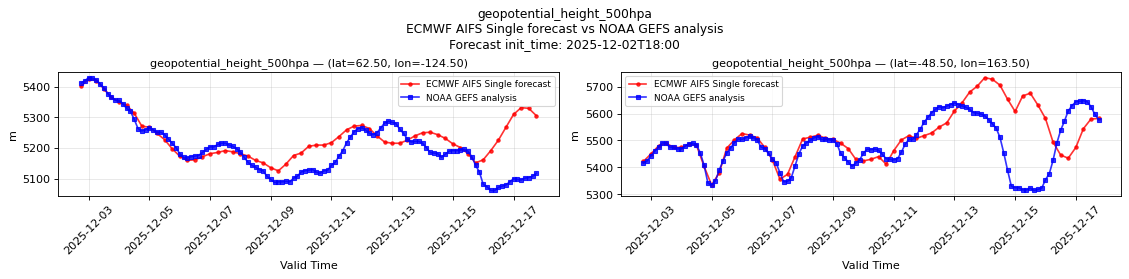
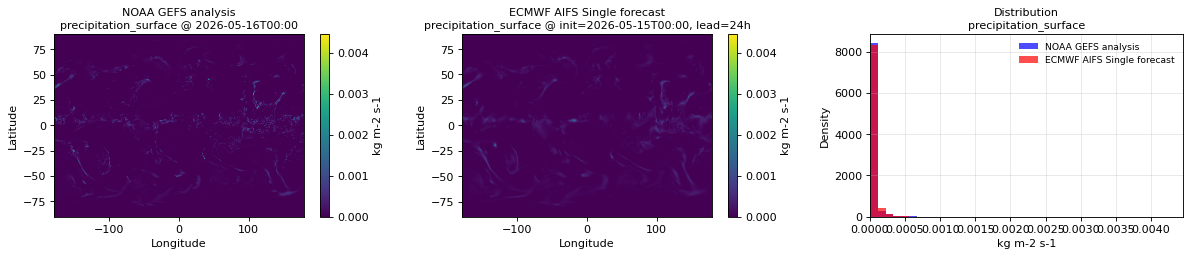
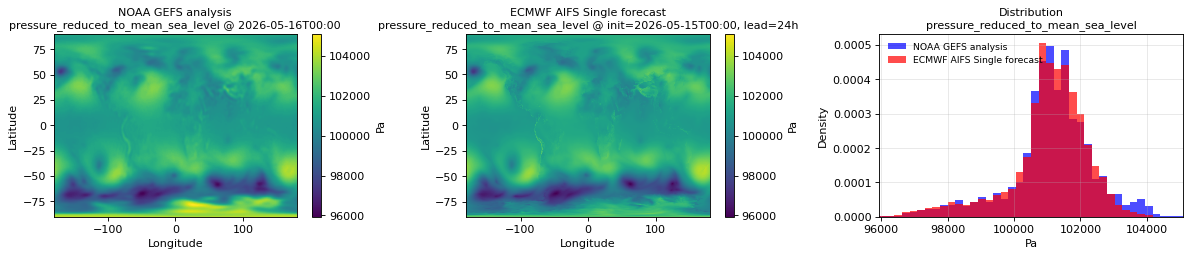
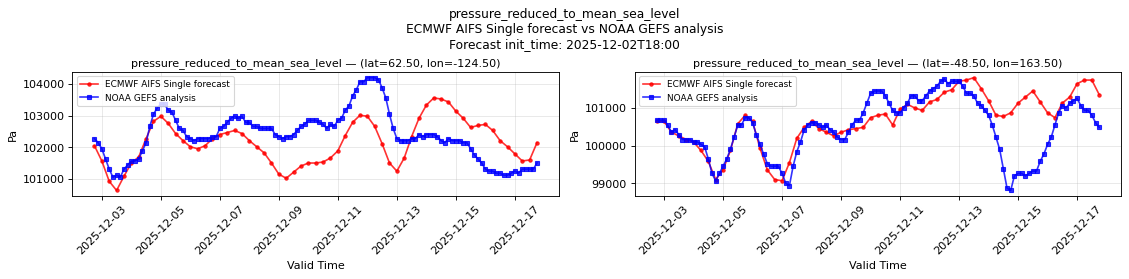
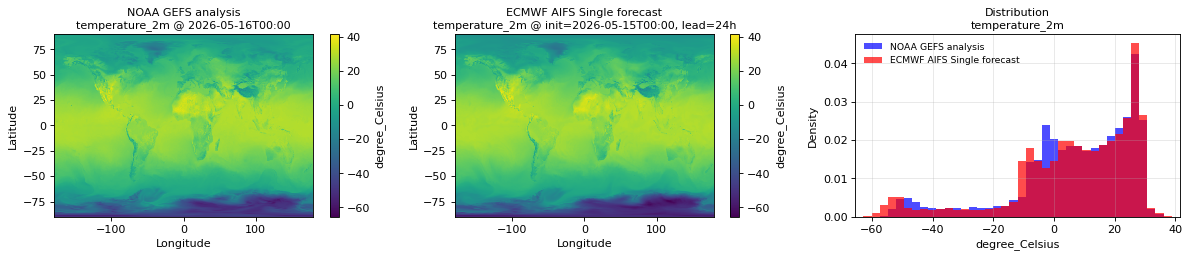
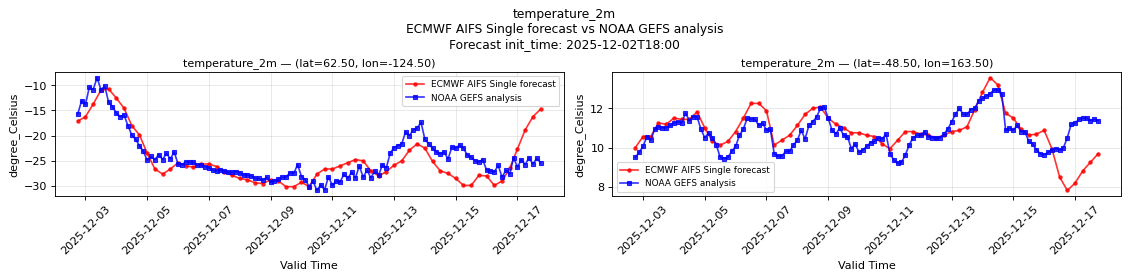
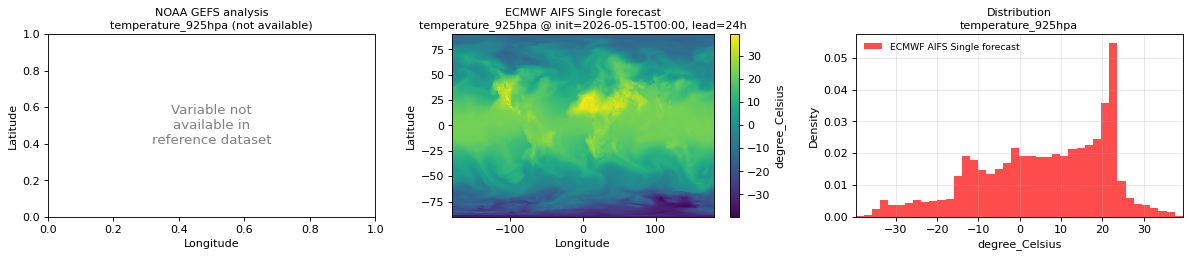
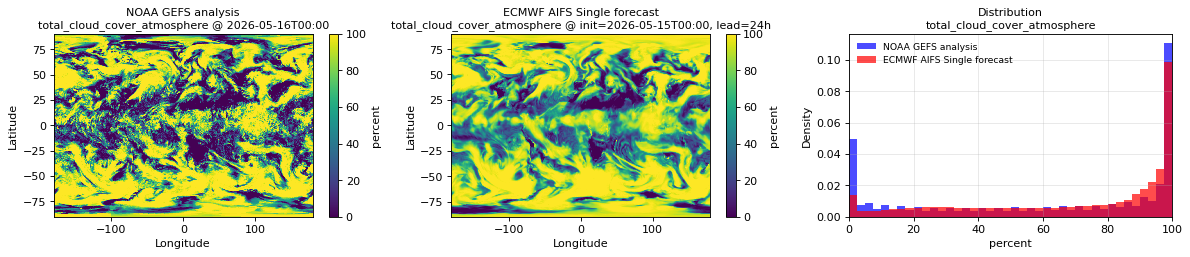
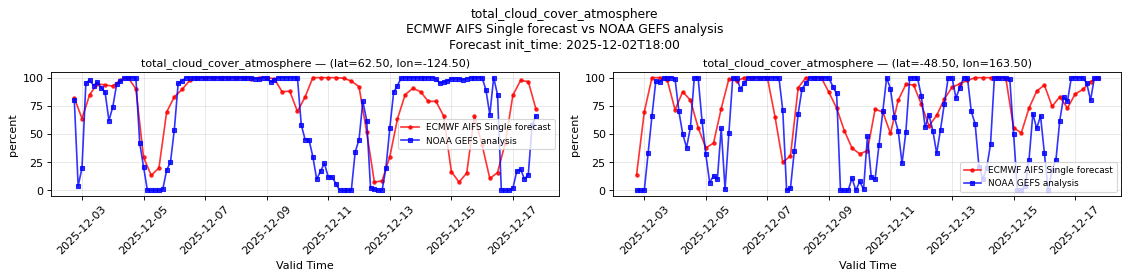
- Close agreement with the reference archive. Where the NOAA GEFS analysis carries the same field, the AIFS values track it in both the maps and the time series. As an AI model AIFS is visibly smoother, with slightly less extreme minima and maxima.
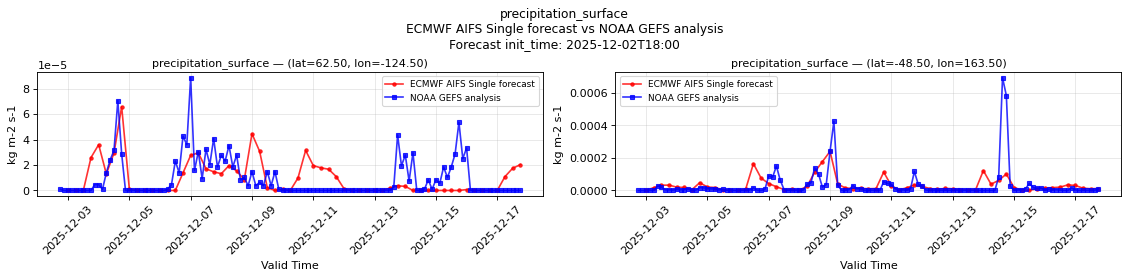
- Forecast physics behave as expected. Solar radiation peaks at the correct local hour and is zero through the night, cloud cover varies inversely with it, and the precipitation and radiation accumulators convert to non-negative rates with no spikes at particular lead times.
- No unit or scale discontinuities across the whole record. This includes the 2025-02-24 change of source feed, where precipitation switches from metres to millimetres upstream and is rescaled here.
Review notes
Unavailable data
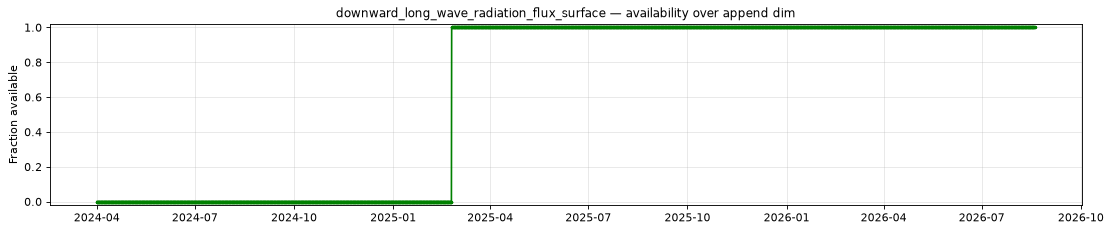
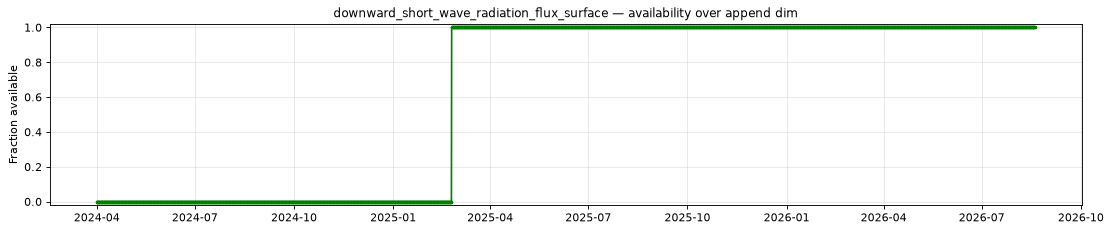
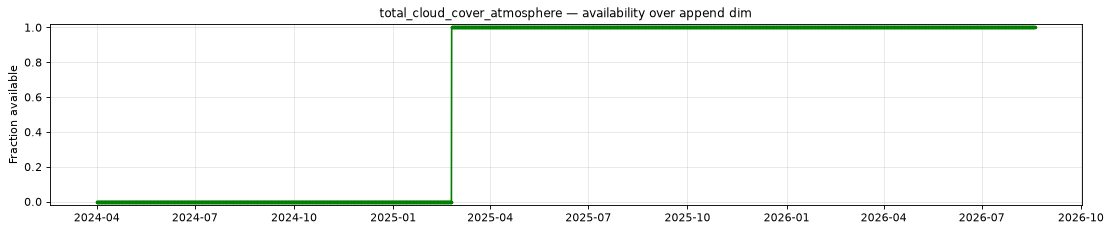
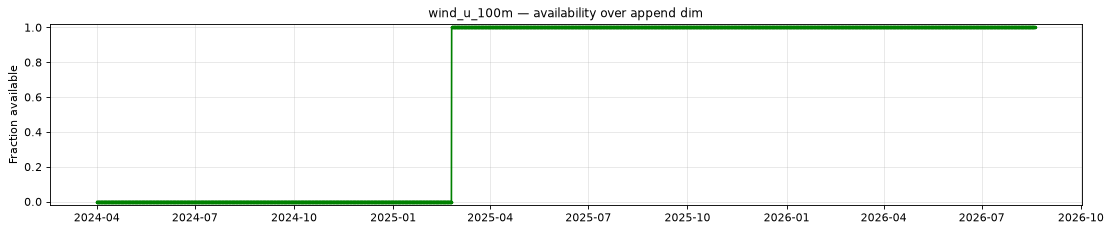
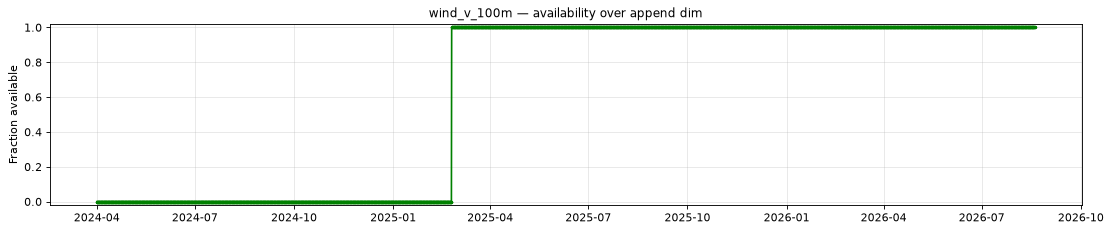
- Five variables begin at the 2025-02-24 06:00 UTC forecast rather than at the start of the archive: the 100-metre wind components, surface downward long-wave and short-wave radiation flux, and total cloud cover. They are complete from that forecast onward. The other twelve variables span the full archive from 2024-04-01.
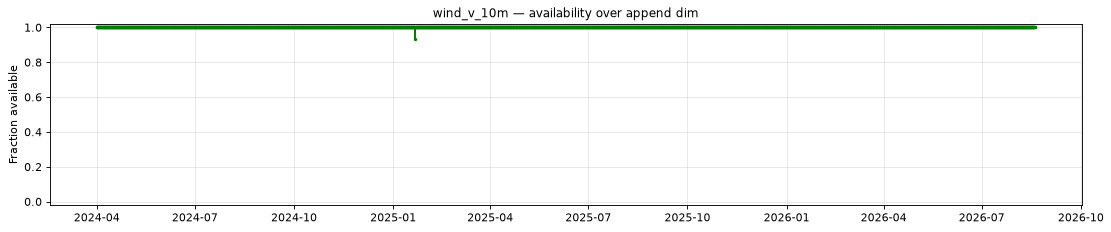
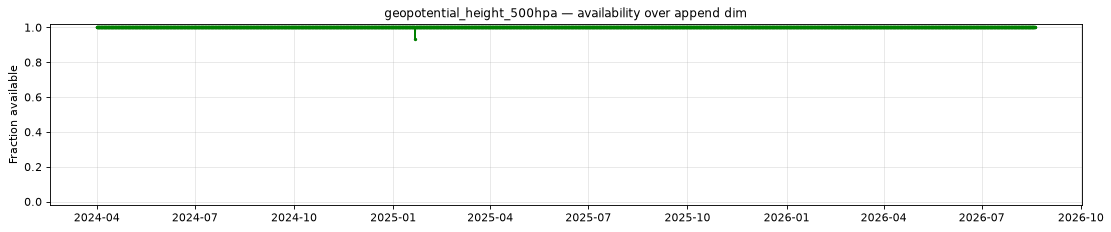
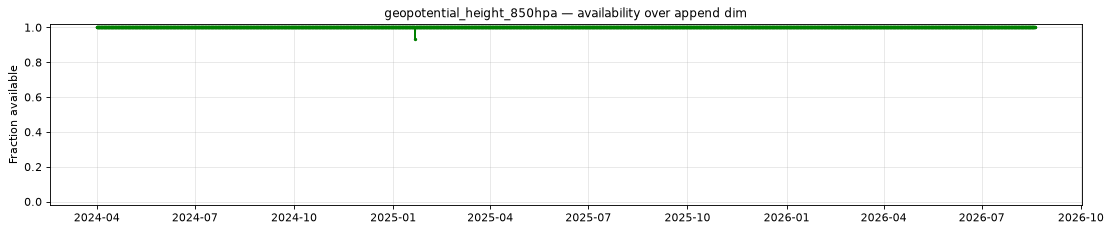
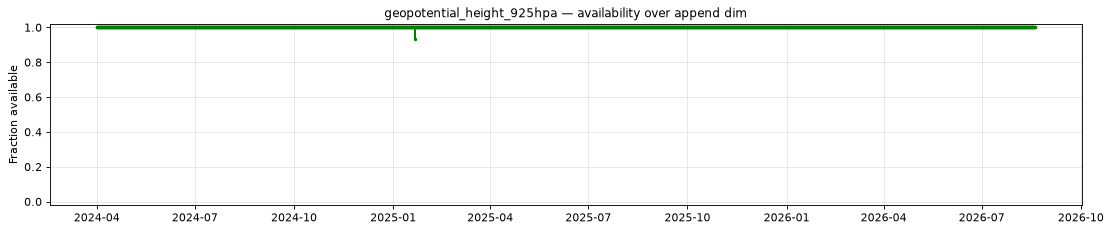
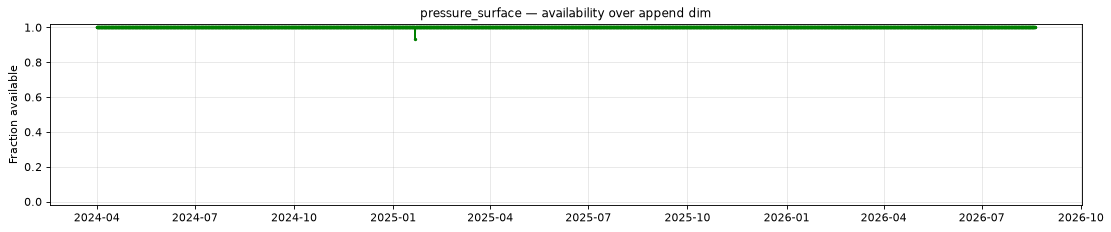
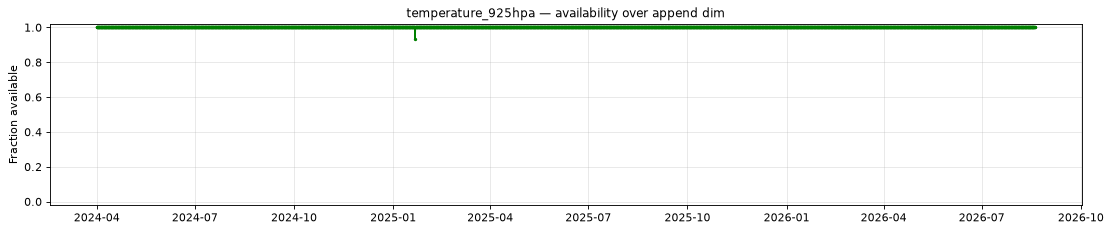
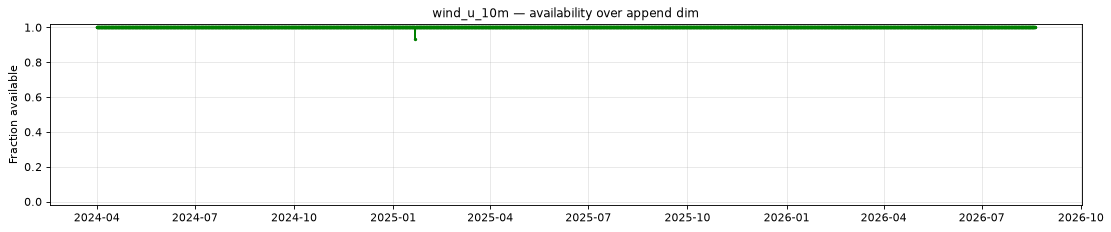
- Four lead times of the 2025-01-21 06:00 UTC forecast are missing from the source: hours 0, 12, 192 and 270. Precipitation is also missing at hours 18, 198 and 276 — the step following each of hours 12, 192 and 270 — because it is a rate measured over the preceding step. The rest of that forecast is intact.
Datasets
| Role | Name | ID | Version | URL |
|---|---|---|---|---|
| Validation | ECMWF AIFS Single forecast | ecmwf-aifs-single-forecast |
v0.1.0 |
s3://us-west-2.opendata.source.coop/dynamical/ecmwf-aifs-single-forecast/v0.1.0.zarr |
| Reference | NOAA GEFS analysis | noaa-gefs-analysis |
0.1.2 |
s3://dynamical-noaa-gefs/noaa-gefs-analysis/v0.1.2.icechunk/ |
Run parameters
| Parameter | Value |
|---|---|
| Validation dataset type | forecast |
| Validation time range | init_time 2024-04-01T00:00 → 2026-08-19T06:00 |
| Reference time range | time 2000-01-01T00:00 → 2026-08-19T06:00 |
| Point 1 | lat=62.5000, lon=-124.5000 |
| Point 2 | lat=-48.5000, lon=163.5000 |
| Spatial comparison time | init=2026-07-15T00:00, lead=126h (reference at 2026-07-20T06:00) |
| Timeseries period | init=2026-07-15T00:00 |
Availability
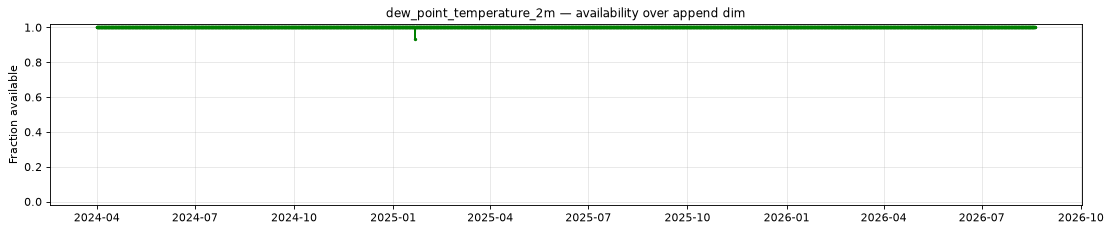
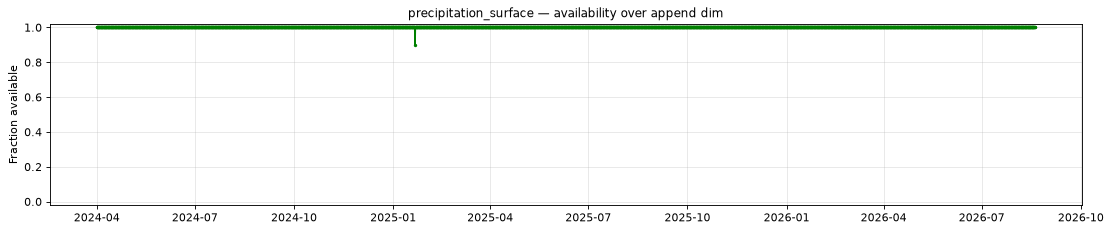
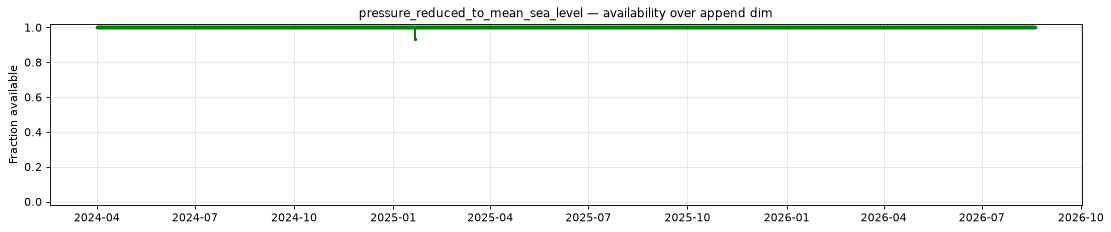
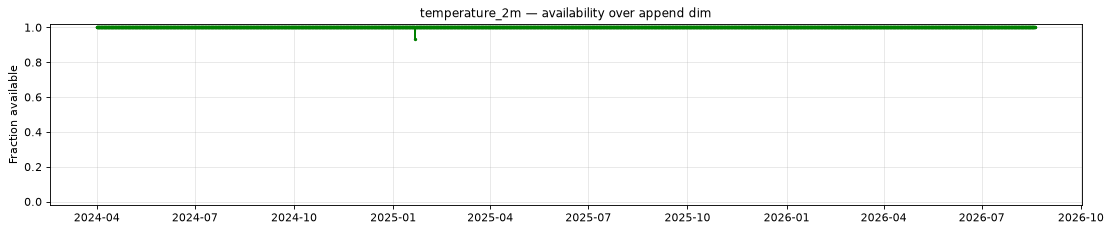
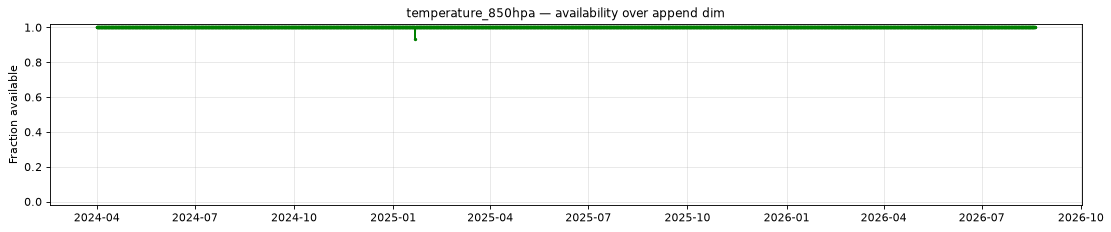
The plot below shows the availability of each variable over time — light red marks unavailable data, dark green marks present data.
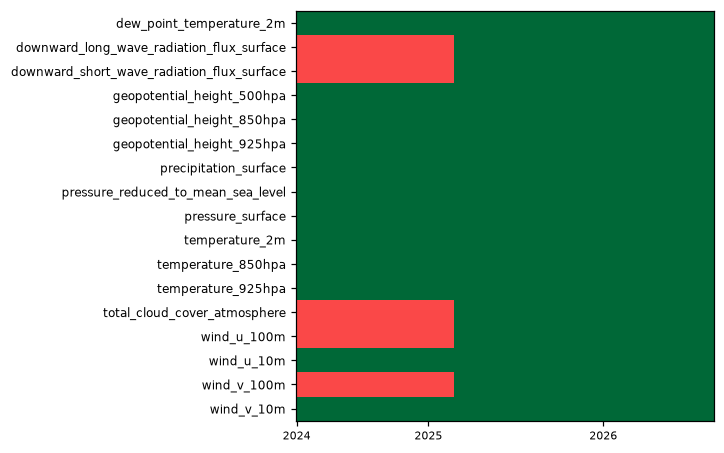
| Variable | Complete positions | Incomplete % | First incomplete | Last incomplete |
|---|---|---|---|---|
dew_point_temperature_2m |
3481/3482 | 0.03% | 2025-01-21T06:00 | 2025-01-21T06:00 |
downward_long_wave_radiation_flux_surface |
2165/3482 | 37.82% | 2024-04-01T00:00 | 2025-02-24T00:00 |
downward_short_wave_radiation_flux_surface |
2165/3482 | 37.82% | 2024-04-01T00:00 | 2025-02-24T00:00 |
geopotential_height_500hpa |
3481/3482 | 0.03% | 2025-01-21T06:00 | 2025-01-21T06:00 |
geopotential_height_850hpa |
3481/3482 | 0.03% | 2025-01-21T06:00 | 2025-01-21T06:00 |
geopotential_height_925hpa |
3481/3482 | 0.03% | 2025-01-21T06:00 | 2025-01-21T06:00 |
precipitation_surface |
3481/3482 | 0.03% | 2025-01-21T06:00 | 2025-01-21T06:00 |
pressure_reduced_to_mean_sea_level |
3481/3482 | 0.03% | 2025-01-21T06:00 | 2025-01-21T06:00 |
pressure_surface |
3481/3482 | 0.03% | 2025-01-21T06:00 | 2025-01-21T06:00 |
temperature_2m |
3481/3482 | 0.03% | 2025-01-21T06:00 | 2025-01-21T06:00 |
temperature_850hpa |
3481/3482 | 0.03% | 2025-01-21T06:00 | 2025-01-21T06:00 |
temperature_925hpa |
3481/3482 | 0.03% | 2025-01-21T06:00 | 2025-01-21T06:00 |
total_cloud_cover_atmosphere |
2165/3482 | 37.82% | 2024-04-01T00:00 | 2025-02-24T00:00 |
wind_u_100m |
2165/3482 | 37.82% | 2024-04-01T00:00 | 2025-02-24T00:00 |
wind_u_10m |
3481/3482 | 0.03% | 2025-01-21T06:00 | 2025-01-21T06:00 |
wind_v_100m |
2165/3482 | 37.82% | 2024-04-01T00:00 | 2025-02-24T00:00 |
wind_v_10m |
3481/3482 | 0.03% | 2025-01-21T06:00 | 2025-01-21T06:00 |
- Unavailable timestamps:
unavailable_timestamps.txt
Per-variable details
dew_point_temperature_2m
Metadata
| Field | Value |
|---|---|
| units | degree_Celsius |
| long_name | 2 metre dewpoint temperature |
| short_name | 2d |
| standard_name | dew_point_temperature |
| step_type | instant |
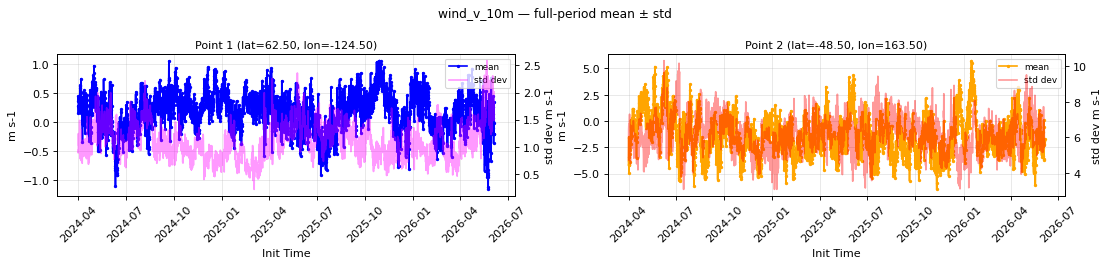
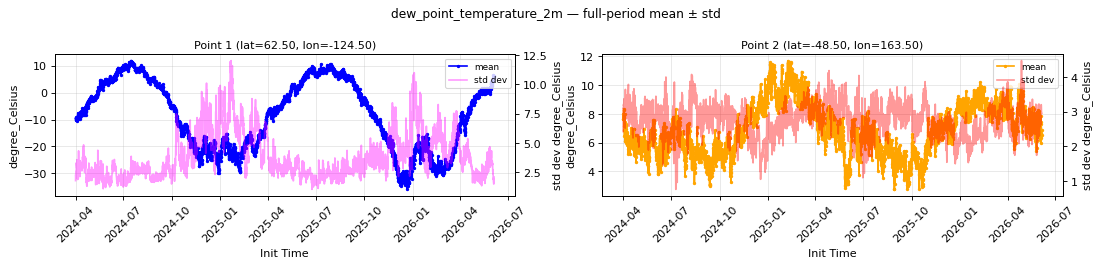
Point time series — 2024-04-01T00:00 - 2026-08-19T06:00
| Point | min | mean | std | max |
|---|---|---|---|---|
| P1 | -35.92 | -6.644 | 3.67 | 11.86 |
| P2 | 2.759 | 6.801 | 2.737 | 11.68 |
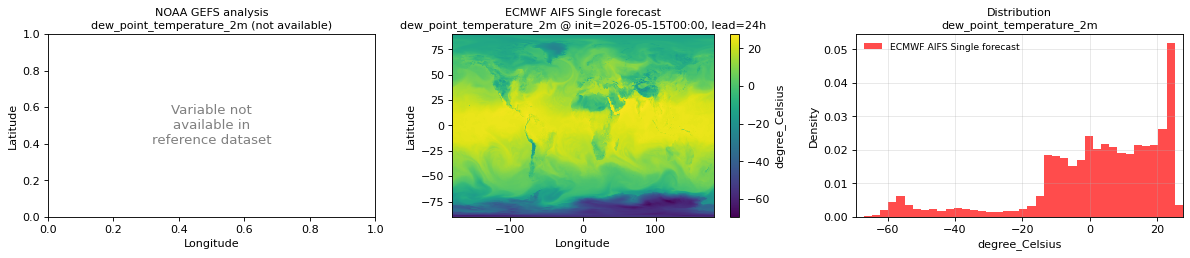
Spatial — init=2026-07-15T00:00, lead=126h (reference not available)
| Source | min | mean | max |
|---|---|---|---|
| Validation | -79.5 | 4.056 | 29.62 |
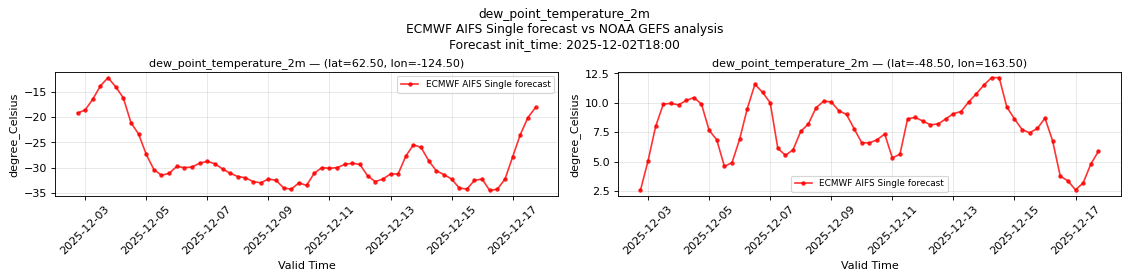
Temporal — init=2026-07-15T00:00
| Source | min | mean | max |
|---|---|---|---|
| P1 Validation | 3.203 | 8.715 | 13.69 |
| P2 Validation | -2.156 | 4.631 | 9.25 |
Availability — 3481 of 3482 positions complete (incomplete 2025-01-21T06:00 → 2025-01-21T06:00); nulls P1 4/212402, P2 4/212402
downward_long_wave_radiation_flux_surface
Metadata
| Field | Value |
|---|---|
| units | W m-2 |
| long_name | Surface downward long-wave radiation flux |
| short_name | sdlwrf |
| standard_name | surface_downwelling_longwave_flux_in_air |
| step_type | avg |
| comment | Average flux since the previous forecast step. |
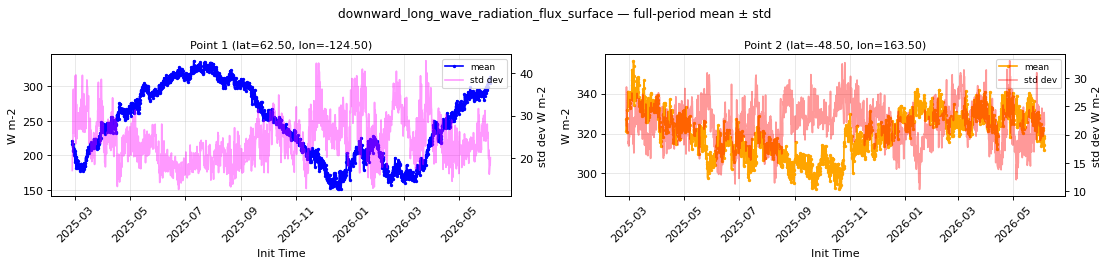
Point time series — 2024-04-01T00:00 - 2026-08-19T06:00
| Point | min | mean | std | max |
|---|---|---|---|---|
| P1 | 150.4 | 256.6 | 23.71 | 341 |
| P2 | 290.3 | 319.7 | 21.8 | 356.6 |
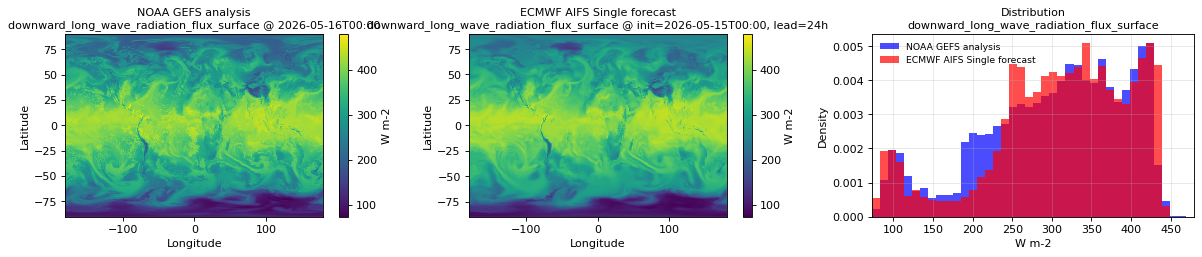
Spatial — init=2026-07-15T00:00, lead=126h (reference at 2026-07-20T06:00)
| Source | min | mean | max |
|---|---|---|---|
| Validation | 44 | 321.6 | 466 |
| Reference | 52 | 314.1 | 476 |
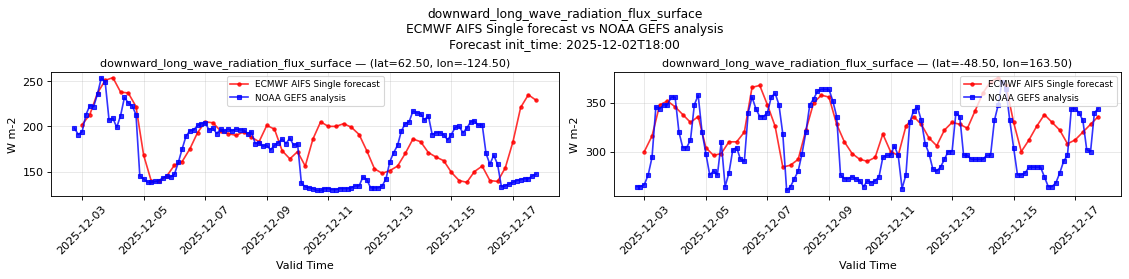
Temporal — init=2026-07-15T00:00
| Source | min | mean | max |
|---|---|---|---|
| P1 Validation | 276 | 319.6 | 350 |
| P1 Reference | 268 | 323 | 376 |
| P2 Validation | 253 | 307.2 | 344 |
| P2 Reference | 239 | 300.4 | 348 |
Availability — 2165 of 3482 positions complete (incomplete 2024-04-01T00:00 → 2025-02-24T00:00); nulls P1 79020/208920, P2 79020/208920
downward_short_wave_radiation_flux_surface
Metadata
| Field | Value |
|---|---|
| units | W m-2 |
| long_name | Surface downward short-wave radiation flux |
| short_name | sdswrf |
| standard_name | surface_downwelling_shortwave_flux_in_air |
| step_type | avg |
| comment | Average flux since the previous forecast step. |
Point time series — 2024-04-01T00:00 - 2026-08-19T06:00
| Point | min | mean | std | max |
|---|---|---|---|---|
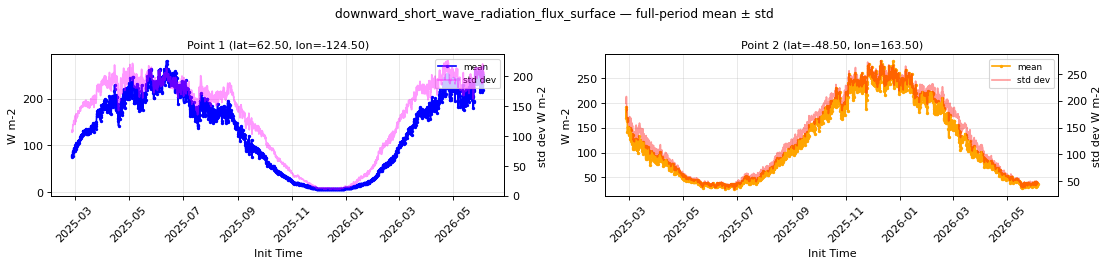
| P1 | 5.359 | 139.9 | 138.2 | 281.1 |
| P2 | 25.4 | 110.9 | 123.2 | 284.8 |
Spatial — init=2026-07-15T00:00, lead=126h (reference at 2026-07-20T06:00)
| Source | min | mean | max |
|---|---|---|---|
| Validation | 0 | 155.1 | 880 |
| Reference | 0 | 164.1 | 900 |
Temporal — init=2026-07-15T00:00
| Source | min | mean | max |
|---|---|---|---|
| P1 Validation | 0 | 237.5 | 688 |
| P1 Reference | 0 | 242.6 | 756 |
| P2 Validation | 0 | 38.53 | 188 |
| P2 Reference | 0 | 40.41 | 312 |
Availability — 2165 of 3482 positions complete (incomplete 2024-04-01T00:00 → 2025-02-24T00:00); nulls P1 79020/208920, P2 79020/208920
geopotential_height_500hpa
Metadata
| Field | Value |
|---|---|
| units | m |
| long_name | Geopotential height |
| short_name | gh |
| standard_name | geopotential_height |
| step_type | instant |
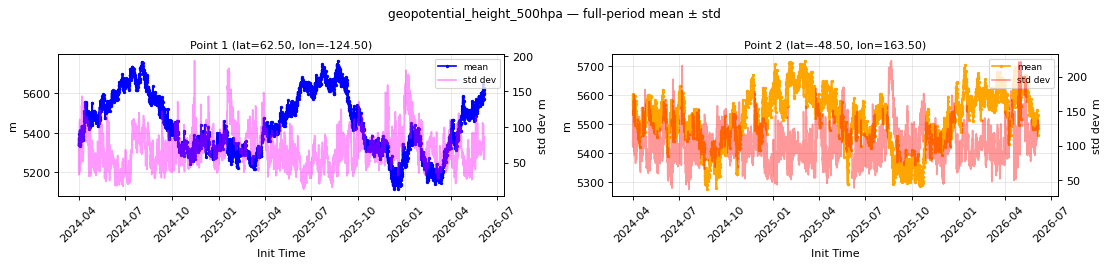
Point time series — 2024-04-01T00:00 - 2026-08-19T06:00
| Point | min | mean | std | max |
|---|---|---|---|---|
| P1 | 5112 | 5459 | 67.09 | 5766 |
| P2 | 5275 | 5518 | 103.3 | 5718 |
Spatial — init=2026-07-15T00:00, lead=126h (reference at 2026-07-20T06:00)
| Source | min | mean | max |
|---|---|---|---|
| Validation | 4618 | 5587 | 5976 |
| Reference | 4608 | 5576 | 5982 |
Temporal — init=2026-07-15T00:00
| Source | min | mean | max |
|---|---|---|---|
| P1 Validation | 5538 | 5669 | 5790 |
| P1 Reference | 5524 | 5664 | 5814 |
| P2 Validation | 5228 | 5450 | 5610 |
| P2 Reference | 5162 | 5464 | 5614 |
Availability — 3481 of 3482 positions complete (incomplete 2025-01-21T06:00 → 2025-01-21T06:00); nulls P1 4/212402, P2 4/212402
geopotential_height_850hpa
Metadata
| Field | Value |
|---|---|
| units | m |
| long_name | Geopotential height |
| short_name | gh |
| standard_name | geopotential_height |
| step_type | instant |
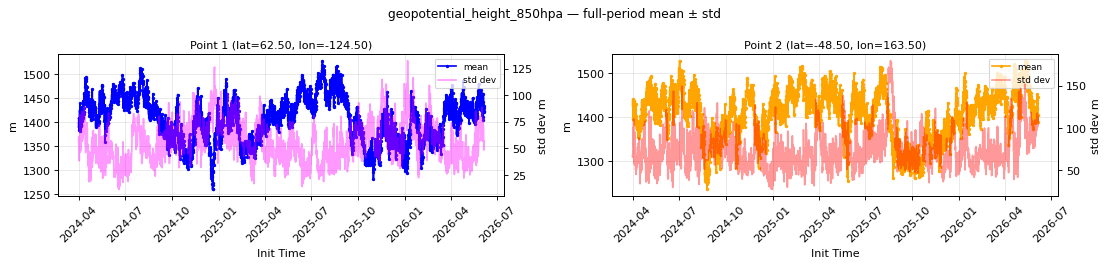
Point time series — 2024-04-01T00:00 - 2026-08-19T06:00
| Point | min | mean | std | max |
|---|---|---|---|---|
| P1 | 1259 | 1412 | 53.86 | 1528 |
| P2 | 1235 | 1410 | 74.09 | 1529 |
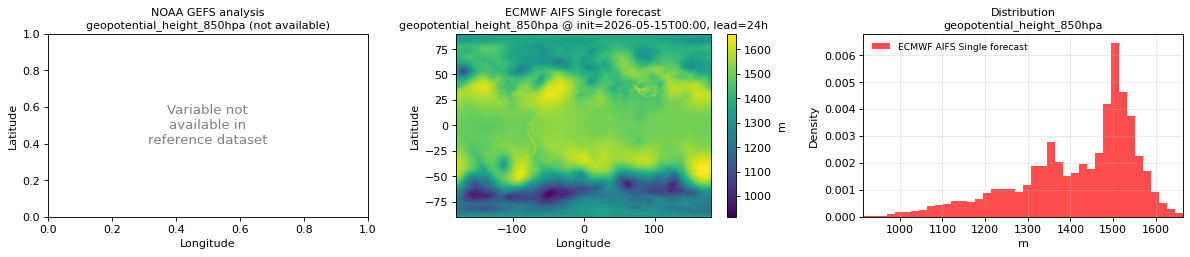
Spatial — init=2026-07-15T00:00, lead=126h (reference not available)
| Source | min | mean | max |
|---|---|---|---|
| Validation | 878.8 | 1422 | 1638 |
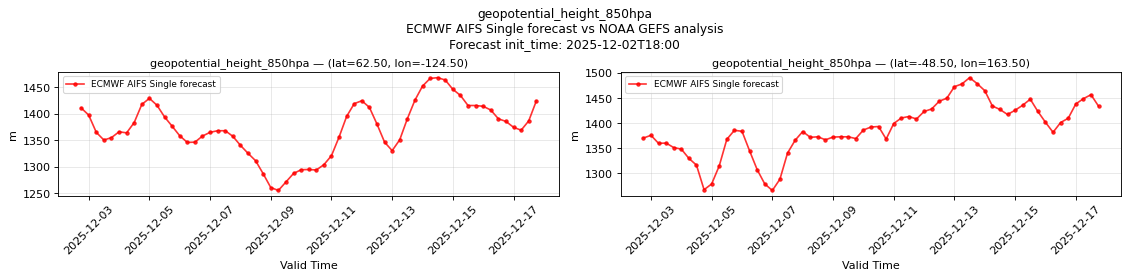
Temporal — init=2026-07-15T00:00
| Source | min | mean | max |
|---|---|---|---|
| P1 Validation | 1374 | 1450 | 1560 |
| P2 Validation | 1252 | 1405 | 1530 |
Availability — 3481 of 3482 positions complete (incomplete 2025-01-21T06:00 → 2025-01-21T06:00); nulls P1 4/212402, P2 4/212402
geopotential_height_925hpa
Metadata
| Field | Value |
|---|---|
| units | m |
| long_name | Geopotential height |
| short_name | gh |
| standard_name | geopotential_height |
| step_type | instant |
Point time series — 2024-04-01T00:00 - 2026-08-19T06:00
| Point | min | mean | std | max |
|---|---|---|---|---|
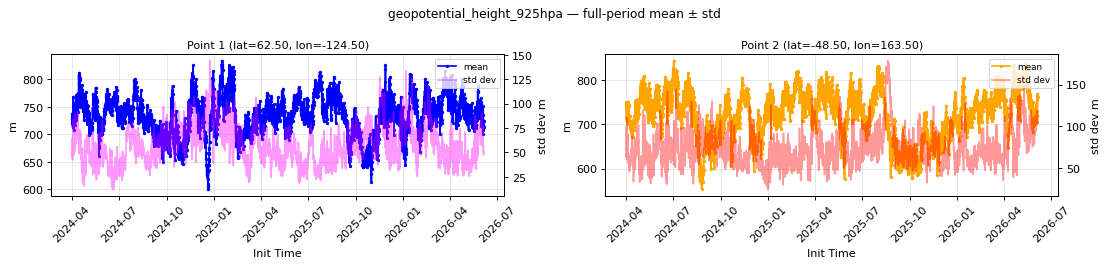
| P1 | 599.9 | 735.2 | 56.59 | 833.5 |
| P2 | 552.7 | 724.9 | 74.14 | 844.4 |
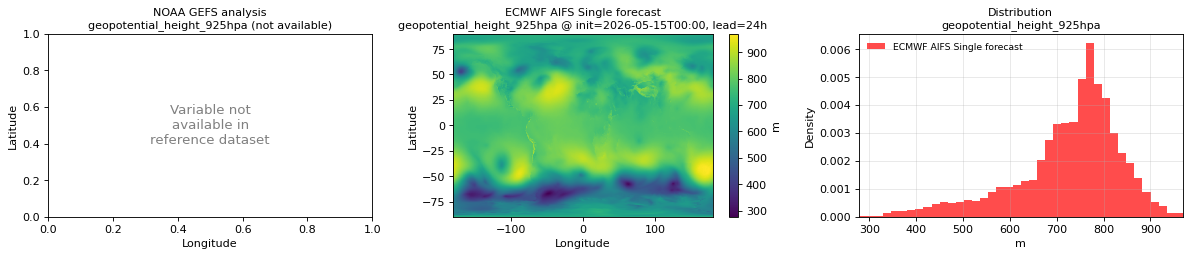
Spatial — init=2026-07-15T00:00, lead=126h (reference not available)
| Source | min | mean | max |
|---|---|---|---|
| Validation | 246.9 | 725.7 | 930.5 |
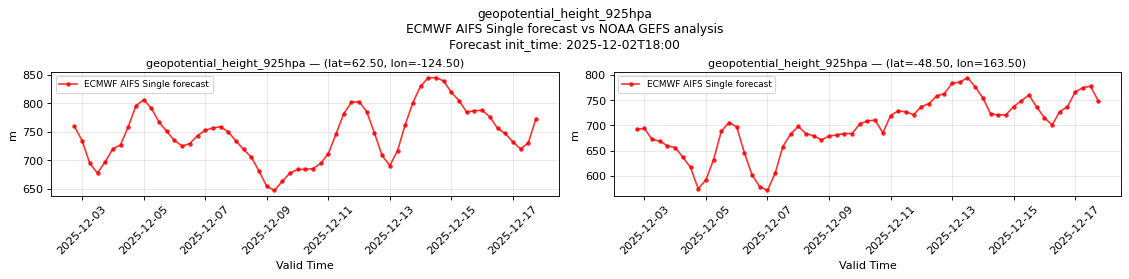
Temporal — init=2026-07-15T00:00
| Source | min | mean | max |
|---|---|---|---|
| P1 Validation | 663.5 | 735.2 | 848.8 |
| P2 Validation | 570.8 | 726.4 | 851.2 |
Availability — 3481 of 3482 positions complete (incomplete 2025-01-21T06:00 → 2025-01-21T06:00); nulls P1 4/212402, P2 4/212402
precipitation_surface
Metadata
| Field | Value |
|---|---|
| units | kg m-2 s-1 |
| long_name | Precipitation rate |
| short_name | prate |
| standard_name | precipitation_flux |
| step_type | avg |
| comment | Average precipitation rate since the previous forecast step. Units equivalent to mm/s. |
Point time series — 2024-04-01T00:00 - 2026-08-19T06:00
| Point | min | mean | std | max |
|---|---|---|---|---|
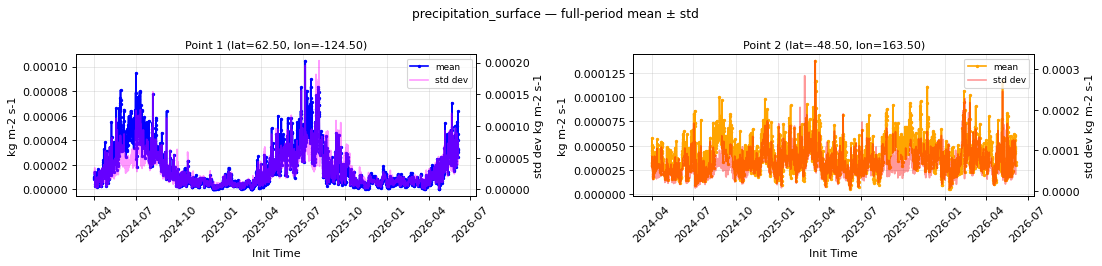
| P1 | 9.034e-09 | 2.045e-05 | 3.206e-05 | 0.0001445 |
| P2 | 5.083e-06 | 3.91e-05 | 6.627e-05 | 0.0001374 |
Spatial — init=2026-07-15T00:00, lead=126h (reference at 2026-07-20T06:00)
| Source | min | mean | max |
|---|---|---|---|
| Validation | 0 | 3.142e-05 | 0.002396 |
| Reference | 0 | 2.891e-05 | 0.003967 |
Temporal — init=2026-07-15T00:00
| Source | min | mean | max |
|---|---|---|---|
| P1 Validation | 0 | 3.274e-05 | 0.0001631 |
| P1 Reference | 0 | 1.906e-05 | 0.000351 |
| P2 Validation | 0 | 5.218e-05 | 0.0003567 |
| P2 Reference | 0 | 3.595e-05 | 0.0005989 |
Availability — 3481 of 3482 positions complete (incomplete 2025-01-21T06:00 → 2025-01-21T06:00); nulls P1 6/208920, P2 6/208920
pressure_reduced_to_mean_sea_level
Metadata
| Field | Value |
|---|---|
| units | Pa |
| long_name | Pressure reduced to MSL |
| short_name | prmsl |
| standard_name | air_pressure_at_mean_sea_level |
| step_type | instant |
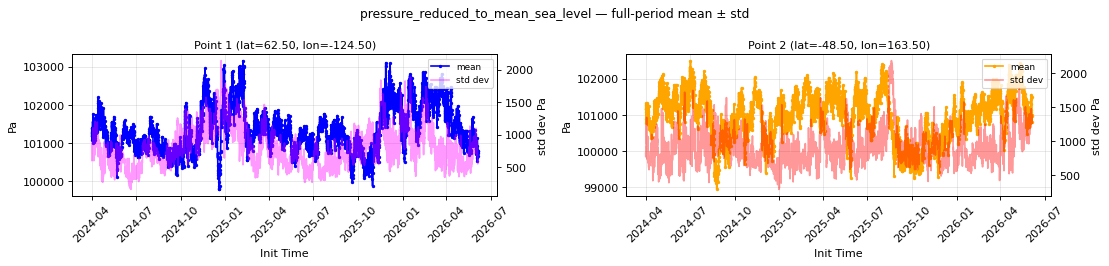
Point time series — 2024-04-01T00:00 - 2026-08-19T06:00
| Point | min | mean | std | max |
|---|---|---|---|---|
| P1 | 9.978e+04 | 1.013e+05 | 771.7 | 1.032e+05 |
| P2 | 9.895e+04 | 1.01e+05 | 920.8 | 1.025e+05 |
Spatial — init=2026-07-15T00:00, lead=126h (reference at 2026-07-20T06:00)
| Source | min | mean | max |
|---|---|---|---|
| Validation | 9.558e+04 | 1.01e+05 | 1.038e+05 |
| Reference | 9.542e+04 | 1.01e+05 | 1.059e+05 |
Temporal — init=2026-07-15T00:00
| Source | min | mean | max |
|---|---|---|---|
| P1 Validation | 1e+05 | 1.009e+05 | 1.022e+05 |
| P1 Reference | 9.92e+04 | 1.01e+05 | 1.023e+05 |
| P2 Validation | 9.91e+04 | 1.011e+05 | 1.027e+05 |
| P2 Reference | 9.907e+04 | 1.011e+05 | 1.028e+05 |
Availability — 3481 of 3482 positions complete (incomplete 2025-01-21T06:00 → 2025-01-21T06:00); nulls P1 4/212402, P2 4/212402
pressure_surface
Metadata
| Field | Value |
|---|---|
| units | Pa |
| long_name | Surface pressure |
| short_name | sp |
| standard_name | surface_air_pressure |
| step_type | instant |
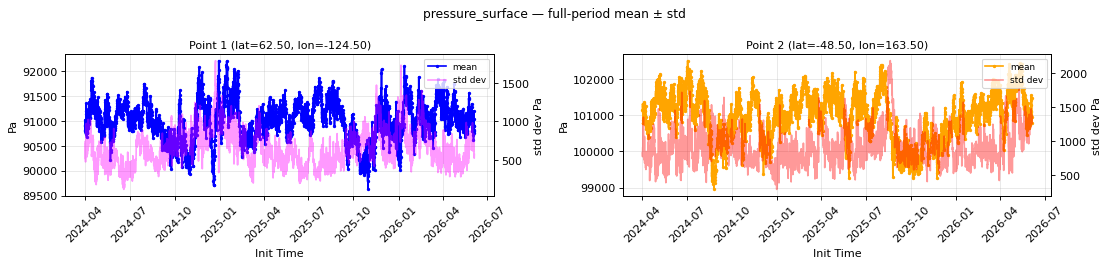
Point time series — 2024-04-01T00:00 - 2026-08-19T06:00
| Point | min | mean | std | max |
|---|---|---|---|---|
| P1 | 8.962e+04 | 9.102e+04 | 636 | 9.22e+04 |
| P2 | 9.895e+04 | 1.01e+05 | 921.8 | 1.025e+05 |
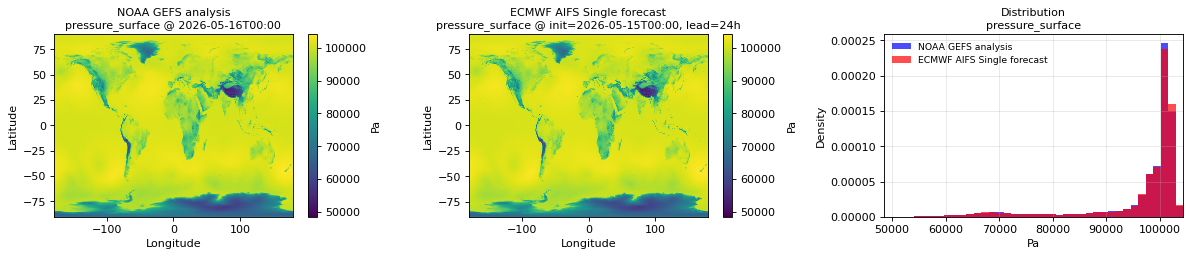
Spatial — init=2026-07-15T00:00, lead=126h (reference at 2026-07-20T06:00)
| Source | min | mean | max |
|---|---|---|---|
| Validation | 4.92e+04 | 9.669e+04 | 1.041e+05 |
| Reference | 5.101e+04 | 9.663e+04 | 1.037e+05 |
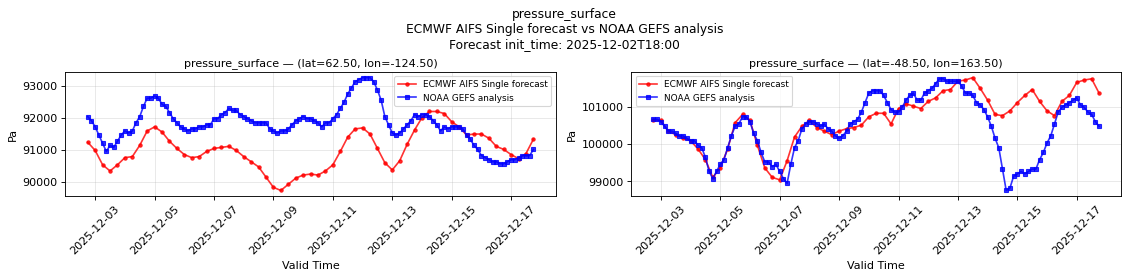
Temporal — init=2026-07-15T00:00
| Source | min | mean | max |
|---|---|---|---|
| P1 Validation | 9.021e+04 | 9.099e+04 | 9.222e+04 |
| P1 Reference | 9.011e+04 | 9.181e+04 | 9.299e+04 |
| P2 Validation | 9.91e+04 | 1.011e+05 | 1.027e+05 |
| P2 Reference | 9.901e+04 | 1.011e+05 | 1.027e+05 |
Availability — 3481 of 3482 positions complete (incomplete 2025-01-21T06:00 → 2025-01-21T06:00); nulls P1 4/212402, P2 4/212402
temperature_2m
Metadata
| Field | Value |
|---|---|
| units | degree_Celsius |
| long_name | 2 metre temperature |
| short_name | 2t |
| standard_name | air_temperature |
| step_type | instant |
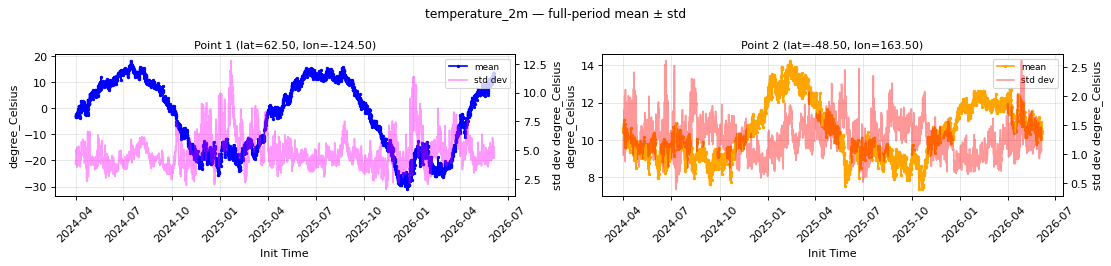
Point time series — 2024-04-01T00:00 - 2026-08-19T06:00
| Point | min | mean | std | max |
|---|---|---|---|---|
| P1 | -31.09 | -1.829 | 4.788 | 18.33 |
| P2 | 7.351 | 10.34 | 1.285 | 14.25 |
Spatial — init=2026-07-15T00:00, lead=126h (reference at 2026-07-20T06:00)
| Source | min | mean | max |
|---|---|---|---|
| Validation | -76 | 8.743 | 44.5 |
| Reference | -70.5 | 8.928 | 45.75 |
Temporal — init=2026-07-15T00:00
| Source | min | mean | max |
|---|---|---|---|
| P1 Validation | 6.156 | 15.11 | 25.12 |
| P1 Reference | 1.484 | 14.96 | 27.5 |
| P2 Validation | 5.875 | 9.024 | 11 |
| P2 Reference | 4.781 | 9.307 | 11.5 |
Availability — 3481 of 3482 positions complete (incomplete 2025-01-21T06:00 → 2025-01-21T06:00); nulls P1 4/212402, P2 4/212402
temperature_850hpa
Metadata
| Field | Value |
|---|---|
| units | degree_Celsius |
| long_name | Temperature |
| short_name | t |
| standard_name | air_temperature |
| step_type | instant |
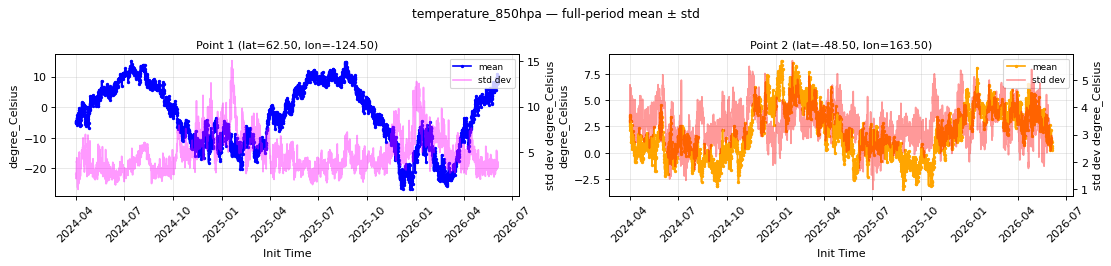
Point time series — 2024-04-01T00:00 - 2026-08-19T06:00
| Point | min | mean | std | max |
|---|---|---|---|---|
| P1 | -26.9 | -1.831 | 4.638 | 15.21 |
| P2 | -3.484 | 1.745 | 3.332 | 8.746 |
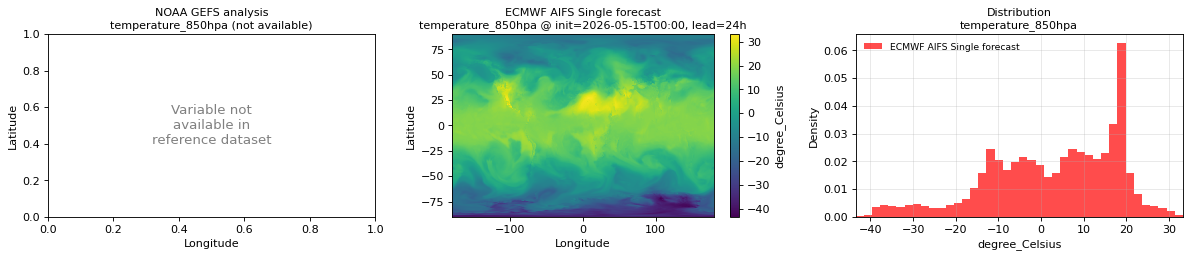
Spatial — init=2026-07-15T00:00, lead=126h (reference not available)
| Source | min | mean | max |
|---|---|---|---|
| Validation | -56.25 | 4.785 | 36.75 |
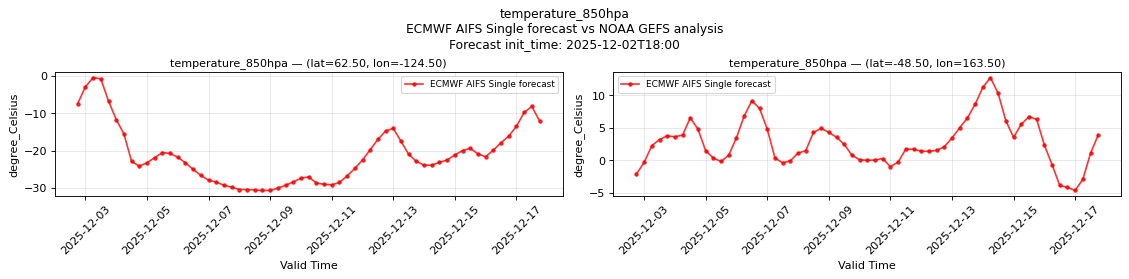
Temporal — init=2026-07-15T00:00
| Source | min | mean | max |
|---|---|---|---|
| P1 Validation | 6.781 | 12.62 | 18.75 |
| P2 Validation | -7.312 | -1.3 | 4.469 |
Availability — 3481 of 3482 positions complete (incomplete 2025-01-21T06:00 → 2025-01-21T06:00); nulls P1 4/212402, P2 4/212402
temperature_925hpa
Metadata
| Field | Value |
|---|---|
| units | degree_Celsius |
| long_name | Temperature |
| short_name | t |
| standard_name | air_temperature |
| step_type | instant |
Point time series — 2024-04-01T00:00 - 2026-08-19T06:00
| Point | min | mean | std | max |
|---|---|---|---|---|
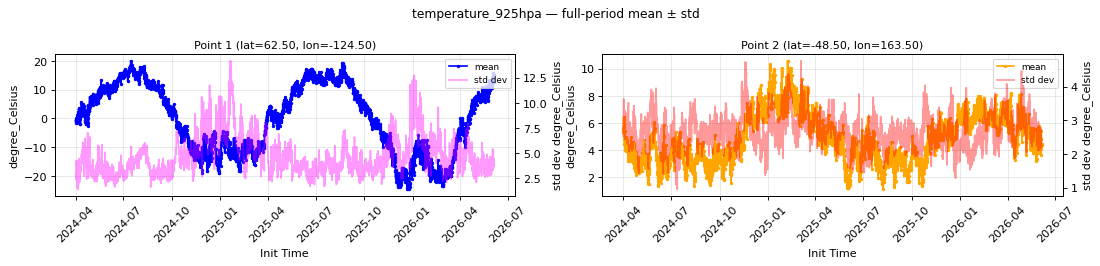
| P1 | -24.65 | 1.195 | 4.547 | 20.03 |
| P2 | 0.9881 | 4.704 | 2.629 | 10.58 |
Spatial — init=2026-07-15T00:00, lead=126h (reference not available)
| Source | min | mean | max |
|---|---|---|---|
| Validation | -53 | 7.806 | 42.25 |
Temporal — init=2026-07-15T00:00
| Source | min | mean | max |
|---|---|---|---|
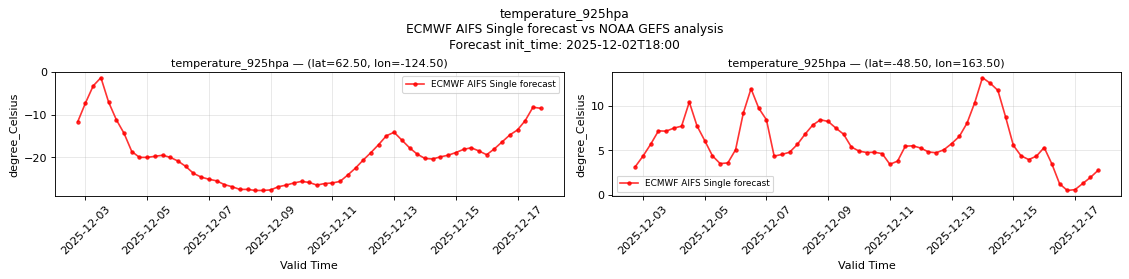
| P1 Validation | 11 | 17.44 | 25.12 |
| P2 Validation | -1.93 | 2.533 | 7.594 |
Availability — 3481 of 3482 positions complete (incomplete 2025-01-21T06:00 → 2025-01-21T06:00); nulls P1 4/212402, P2 4/212402
total_cloud_cover_atmosphere
Metadata
| Field | Value |
|---|---|
| units | percent |
| long_name | Total cloud cover |
| short_name | tcc |
| standard_name | cloud_area_fraction |
| step_type | instant |
Point time series — 2024-04-01T00:00 - 2026-08-19T06:00
| Point | min | mean | std | max |
|---|---|---|---|---|
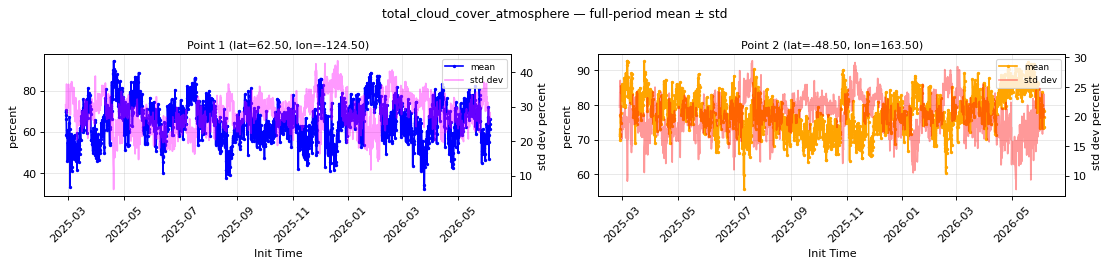
| P1 | 31.08 | 64.68 | 27.79 | 94.53 |
| P2 | 55.65 | 78.17 | 20.05 | 92.68 |
Spatial — init=2026-07-15T00:00, lead=126h (reference at 2026-07-20T06:00)
| Source | min | mean | max |
|---|---|---|---|
| Validation | 0 | 67.97 | 100 |
| Reference | 0 | 63.99 | 100 |
Temporal — init=2026-07-15T00:00
| Source | min | mean | max |
|---|---|---|---|
| P1 Validation | 0.05273 | 50.39 | 97.5 |
| P1 Reference | 0 | 51.51 | 100 |
| P2 Validation | 12.81 | 76.06 | 100 |
| P2 Reference | 0 | 75.41 | 100 |
Availability — 2165 of 3482 positions complete (incomplete 2024-04-01T00:00 → 2025-02-24T00:00); nulls P1 80337/212402, P2 80337/212402
wind_u_100m
Metadata
| Field | Value |
|---|---|
| units | m s-1 |
| long_name | 100 metre U wind component |
| short_name | 100u |
| standard_name | eastward_wind |
| step_type | instant |
Point time series — 2024-04-01T00:00 - 2026-08-19T06:00
| Point | min | mean | std | max |
|---|---|---|---|---|
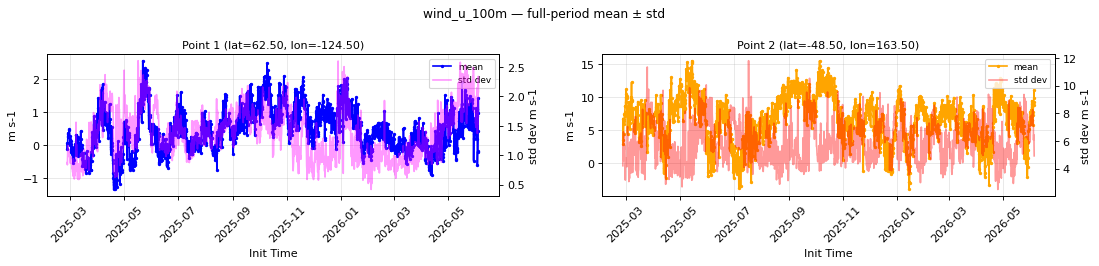
| P1 | -1.355 | 0.4423 | 1.371 | 2.559 |
| P2 | -3.964 | 6.802 | 5.795 | 15.47 |
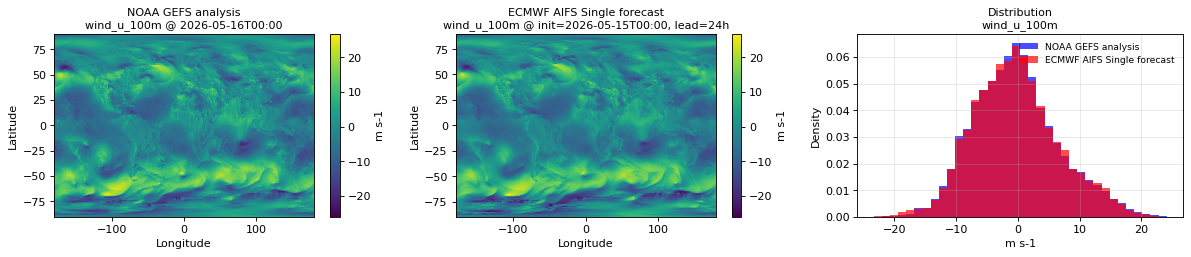
Spatial — init=2026-07-15T00:00, lead=126h (reference at 2026-07-20T06:00)
| Source | min | mean | max |
|---|---|---|---|
| Validation | -33.5 | 0.1191 | 26 |
| Reference | -34 | 0.215 | 29 |
Temporal — init=2026-07-15T00:00
| Source | min | mean | max |
|---|---|---|---|
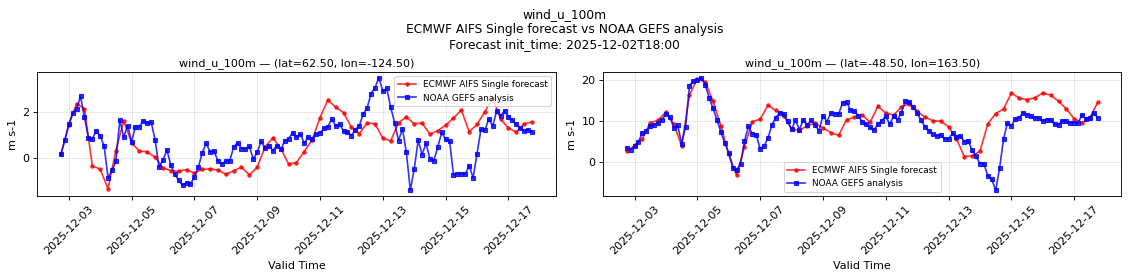
| P1 Validation | -1.812 | 0.6031 | 3.844 |
| P1 Reference | -6 | 0.04696 | 4.5 |
| P2 Validation | 0.5625 | 12.22 | 23 |
| P2 Reference | -1.188 | 9.894 | 18.5 |
Availability — 2165 of 3482 positions complete (incomplete 2024-04-01T00:00 → 2025-02-24T00:00); nulls P1 80337/212402, P2 80337/212402
wind_u_10m
Metadata
| Field | Value |
|---|---|
| units | m s-1 |
| long_name | 10 metre U wind component |
| short_name | 10u |
| standard_name | eastward_wind |
| step_type | instant |
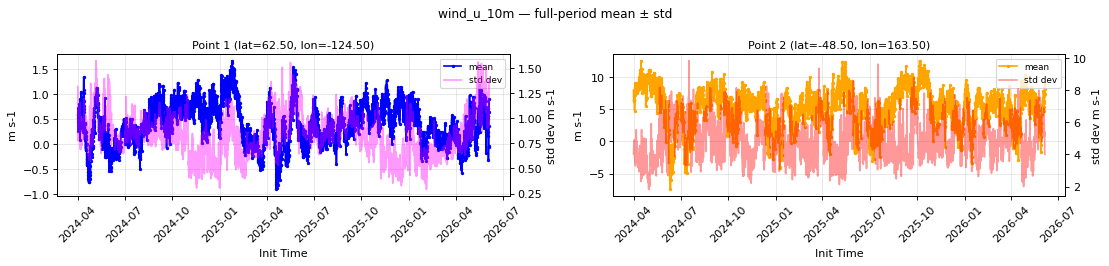
Point time series — 2024-04-01T00:00 - 2026-08-19T06:00
| Point | min | mean | std | max |
|---|---|---|---|---|
| P1 | -0.9083 | 0.3847 | 0.8327 | 1.675 |
| P2 | -7.454 | 5.399 | 4.843 | 12.57 |
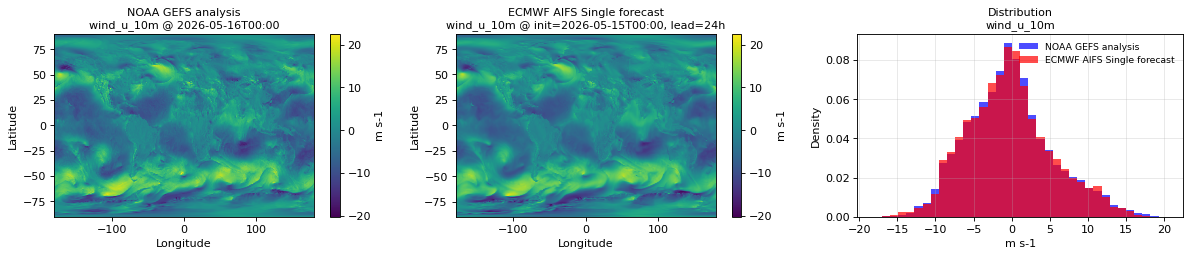
Spatial — init=2026-07-15T00:00, lead=126h (reference at 2026-07-20T06:00)
| Source | min | mean | max |
|---|---|---|---|
| Validation | -26 | 0.1228 | 19.5 |
| Reference | -28.5 | 0.1138 | 23.5 |
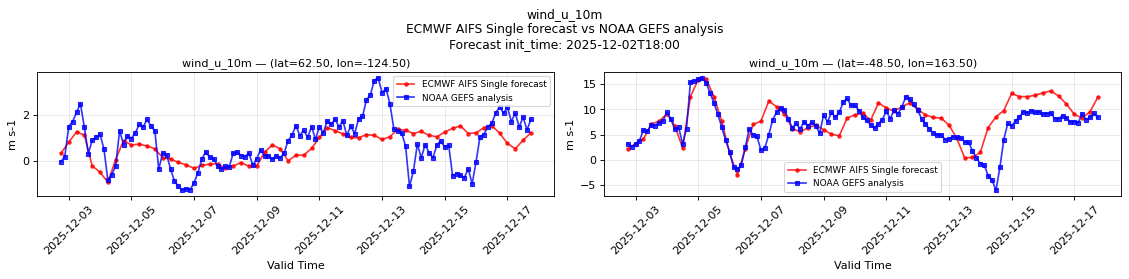
Temporal — init=2026-07-15T00:00
| Source | min | mean | max |
|---|---|---|---|
| P1 Validation | -1.266 | 0.4267 | 2.125 |
| P1 Reference | -4 | -0.1013 | 3.562 |
| P2 Validation | 0.5 | 10.23 | 19 |
| P2 Reference | -1.547 | 8.338 | 15.88 |
Availability — 3481 of 3482 positions complete (incomplete 2025-01-21T06:00 → 2025-01-21T06:00); nulls P1 4/212402, P2 4/212402
wind_v_100m
Metadata
| Field | Value |
|---|---|
| units | m s-1 |
| long_name | 100 metre V wind component |
| short_name | 100v |
| standard_name | northward_wind |
| step_type | instant |
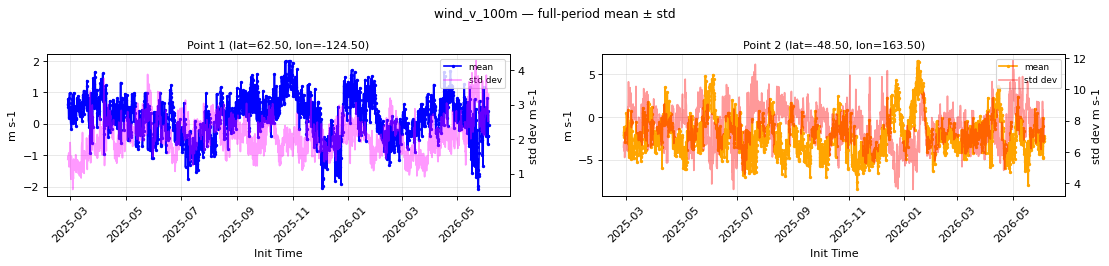
Point time series — 2024-04-01T00:00 - 2026-08-19T06:00
| Point | min | mean | std | max |
|---|---|---|---|---|
| P1 | -2.64 | 0.1238 | 2.144 | 2.003 |
| P2 | -8.506 | -2.017 | 7.652 | 6.605 |
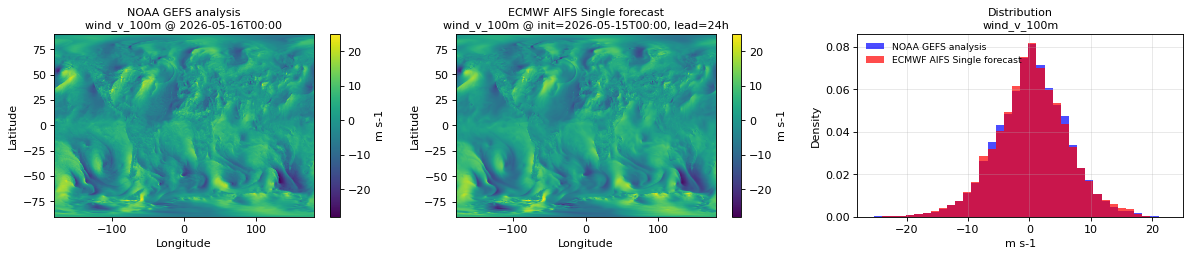
Spatial — init=2026-07-15T00:00, lead=126h (reference at 2026-07-20T06:00)
| Source | min | mean | max |
|---|---|---|---|
| Validation | -22 | 0.6379 | 29.25 |
| Reference | -30 | 0.5084 | 29.75 |
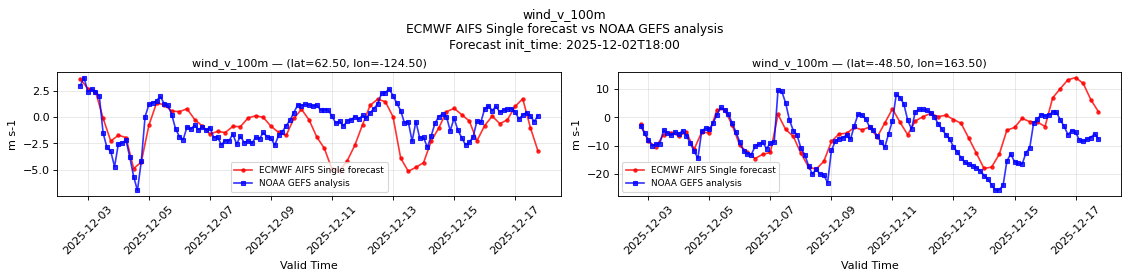
Temporal — init=2026-07-15T00:00
| Source | min | mean | max |
|---|---|---|---|
| P1 Validation | -5.438 | -0.002794 | 4.625 |
| P1 Reference | -7.188 | 0.1516 | 10.12 |
| P2 Validation | -21 | -3.096 | 8.75 |
| P2 Reference | -17.25 | -3.392 | 9.75 |
Availability — 2165 of 3482 positions complete (incomplete 2024-04-01T00:00 → 2025-02-24T00:00); nulls P1 80337/212402, P2 80337/212402
wind_v_10m
Metadata
| Field | Value |
|---|---|
| units | m s-1 |
| long_name | 10 metre V wind component |
| short_name | 10v |
| standard_name | northward_wind |
| step_type | instant |
Point time series — 2024-04-01T00:00 - 2026-08-19T06:00
| Point | min | mean | std | max |
|---|---|---|---|---|
| P1 | -1.484 | 0.1414 | 1.13 | 1.065 |
| P2 | -6.511 | -1.31 | 6.18 | 5.749 |
Spatial — init=2026-07-15T00:00, lead=126h (reference at 2026-07-20T06:00)
| Source | min | mean | max |
|---|---|---|---|
| Validation | -17.5 | 0.6136 | 21 |
| Reference | -24.75 | 0.5029 | 22.25 |
Temporal — init=2026-07-15T00:00
| Source | min | mean | max |
|---|---|---|---|
| P1 Validation | -3.75 | 0.06951 | 2.844 |
| P1 Reference | -6.188 | 0.09374 | 6.438 |
| P2 Validation | -16 | -2.45 | 7.688 |
| P2 Reference | -14.25 | -2.874 | 9 |
Availability — 3481 of 3482 positions complete (incomplete 2025-01-21T06:00 → 2025-01-21T06:00); nulls P1 4/212402, P2 4/212402